

As noted in Part 2, Step 4: Review your audit data in reports(opens in a new window), the reporting platform provides a set of pre-configured reports on your uploaded audit data. You can use these reports to analyse your audit data at any time after moving your audit to a status of ‘Review’.
Part 3 of this guidance describes how to analyse your audit results to:
- support the completion of your progress report
- support the completion of your GEAP
- conduct other analyses of your audit data.
Important note: At the time of developing this guidance, changes are being made to the reporting platform’s reports. These changes:
- provide report measures (that is, tables, charts and figures) needed for the GEAP and progress report for 2025
- improve how the public can explore information on the Insights Portal
- improve the usability of the indicator reports for analysis of your data
- improve and extend the feedback you receive in the data quality report. This will maximise the likelihood of your audit being considered compliant and of high quality.
The information in this section may refer to the current design of the reports (that is, the same as 2023) before these changes have been made.
The changes to the reports will be delivered by July 2025. This guidance will be updated to reflect the changes.
About reports and data measures
The reporting platform provides several reports.
Each report is a collection of small data calculators called data measures.
Most data measures are tables and charts. They are logically grouped together (for example, by indicator).
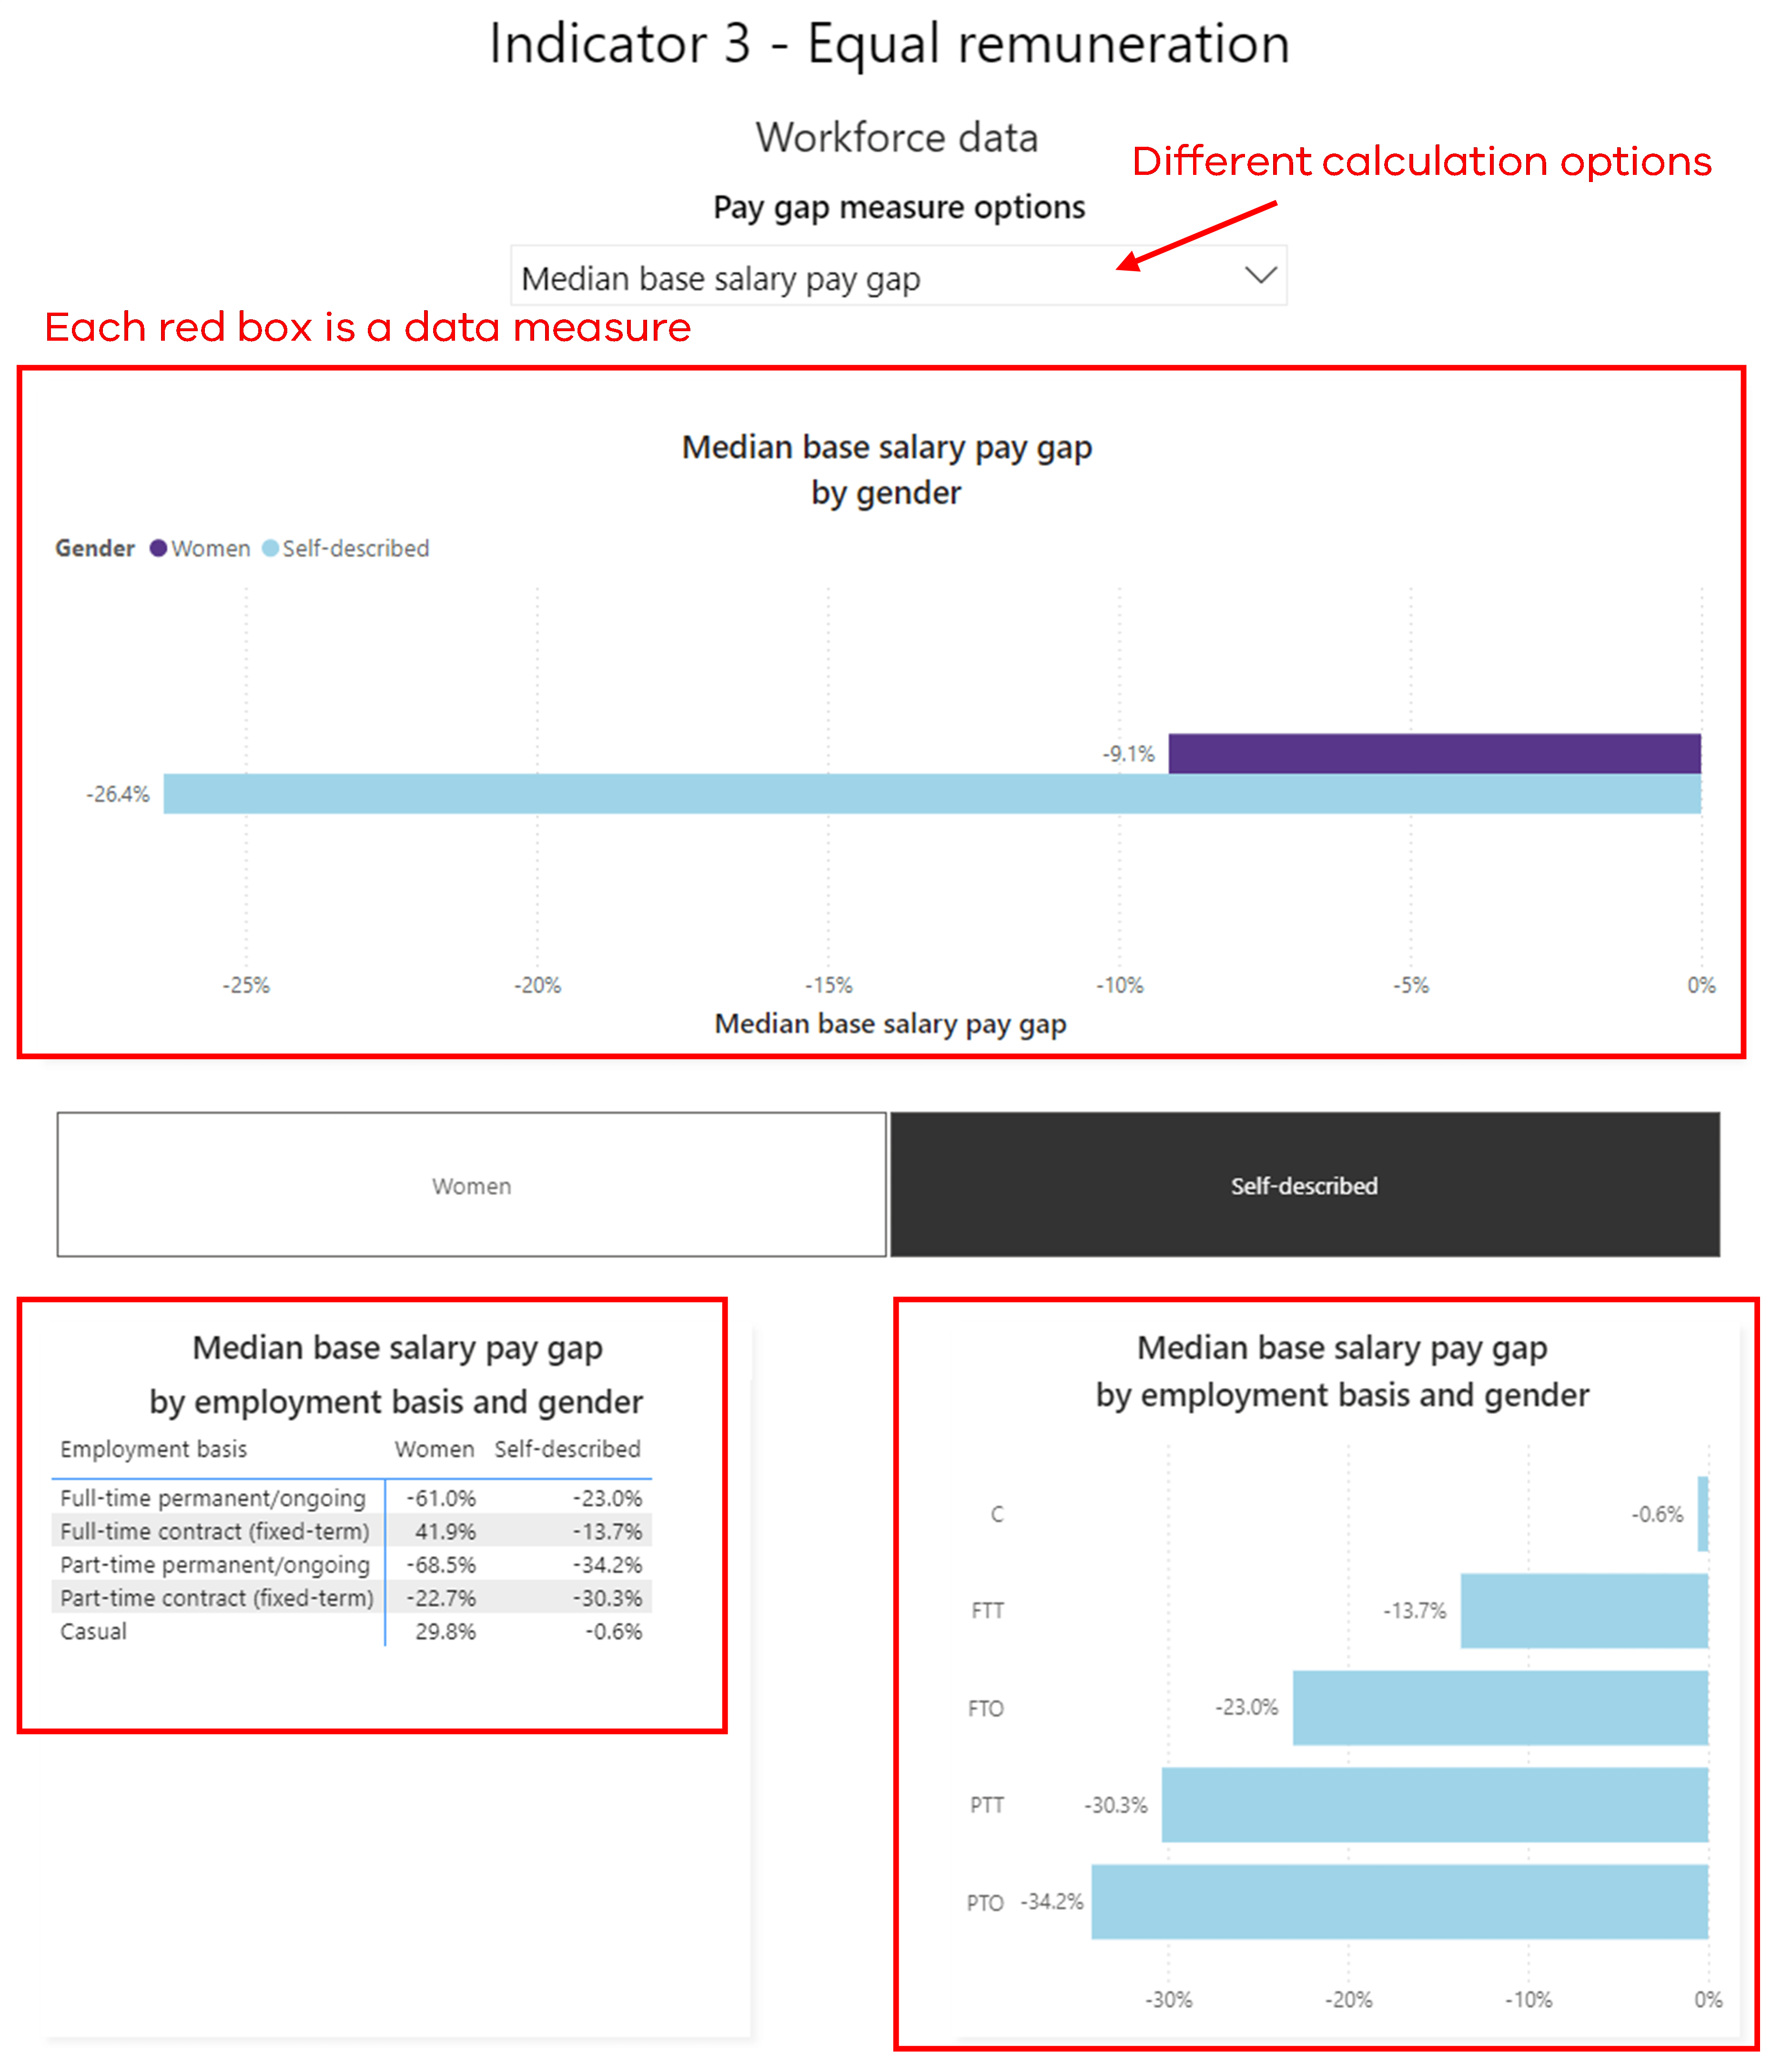
Some data measures support limited interactivity by allowing the viewer to select different calculation methods. Some data measures also allow the viewer to select filtering criteria to focus the measure to present information about a particular view of the data (for example, to show results for a particular age group).
Figure 6: Screenshot showing example report with data measures
Using the reports for analysis
The following reports will be most useful for duty holders:
- The Performance report provides required and recommended data to include in your progress report and GEAP.
- The Indicators report – used to inspect the full range of your uploaded data at any point in time.
Using the Performance report
Use the Performance report to analyse your audit data to include in your GEAP or progress report.
The report provides a view of a set of measures across each of the 7 gender equality indicators. You can (or must) provide these results in your GEAP or progress report.
It provides information from 2 perspectives:
- a point in time – that is, what your data looks like in any of the collection years (2021, 2023, 2025, et cetera).
- movement over time – that is, how your data changed between collection years.
Interacting with the performance report
Note: We will update this section of the audit guidance following release of the performance report. This will show you how users interact with the report.
Recommended analyses
- For guidance on which measures from your audit to include in your GEAP and how to include them, refer to the 2026 Gender Equality Action Plan Guidance (GEAP)(opens in a new window)
- For guidance on which measures from your audit to include in your progress report and how to include them, refer to the 2026 Progress Report Guidance(opens in a new window)
- For general guidance on conducting analysis of your audit data, refer to the release of an analysis guide(opens in a new window) towards the end of June 2025.
Using the Indicators report
Use the Indicators report to inspect your data at a point in time in relation to each of the 7 gender equality indicators.
Note: We will update this section of the audit guidance following release of the updates to the Indicators report.
To access the Indicators report, click on the ‘Indicators’ tab. You will be presented with a report, the top part of which looks like Figure 7.
Figure 7: Screenshot showing the top section of an example Indicators report
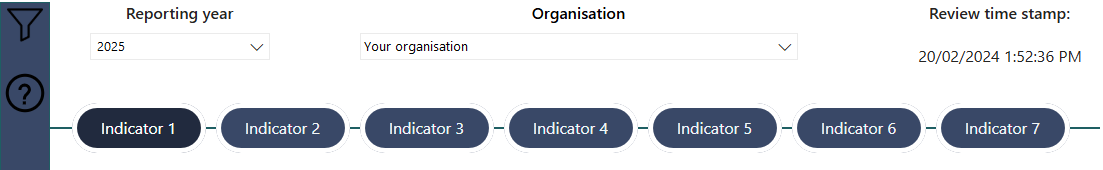
Important! Before using the indicator report, check that the audit data you moved to a status of ‘Review’ has been successfully processed by the reporting platform. Do this by:
- selecting your reporting year (2025)
- ensuring you are reviewing the correct and most recent version of your audit data by checking your data’s ‘Review time stamp’ (refer to ‘4.1 Checking your data is ready to review in reports’).
View your data measures
The steps to view data measures in this report are as follows:
- Select the ‘Reporting year’.
- Select the desired indicator and type of data you wish to review – either ‘Workforce data’ or ‘Employee experience data’.
- If the measure has different views, select the desired view. For example, the workforce data measure for equal remuneration has six different views that can be selected.
- If you wish to filter the results you’re reviewing, select the appropriate filter (see section below for more detail).
- View the results.
- Export the results if you wish to work with the data locally.
About filters
You can use filters in the Indicators report to focus on the information you are most interested in. You can also use them to group information in more useful ways. Access the filters by clicking on the ‘funnel’ filter icon on the top far left of the report.
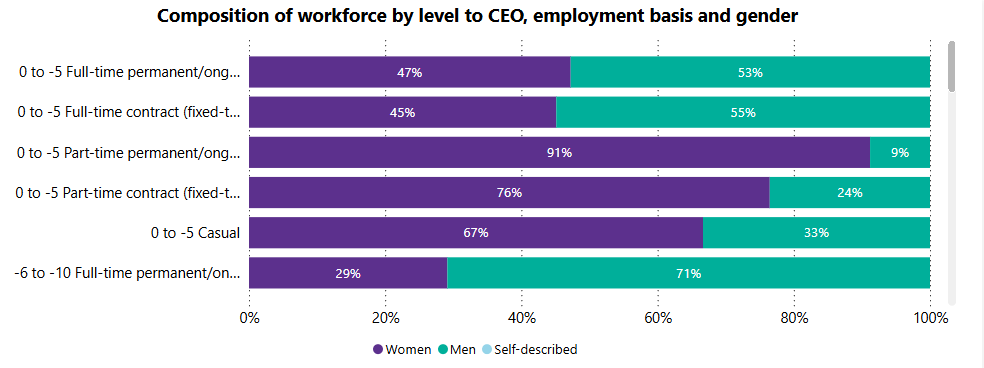
For example, the following figure shows the default view of the ‘Composition of workforce by level to CEO, employment basis and gender’ data measures in indicator 1.
Figure 8: Screenshot of the default view of data measures
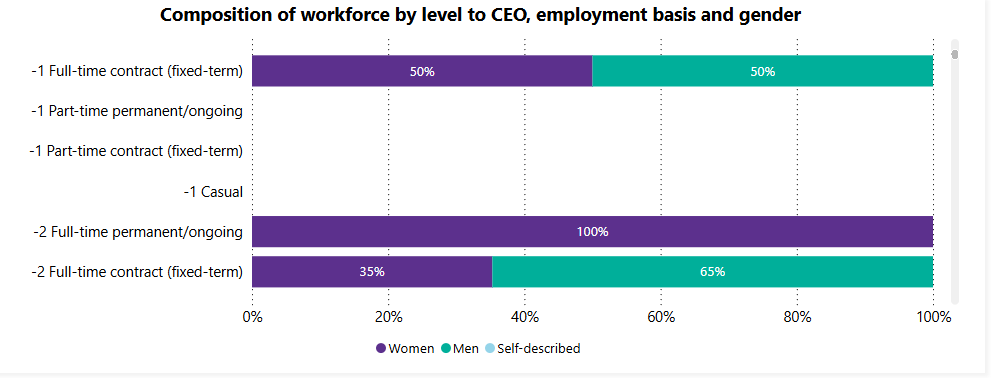
Notice how the vertical axis has a row for each level combined with each possible employment basis. This may display many rows of results. The information might not be meaningful at this level of detail.
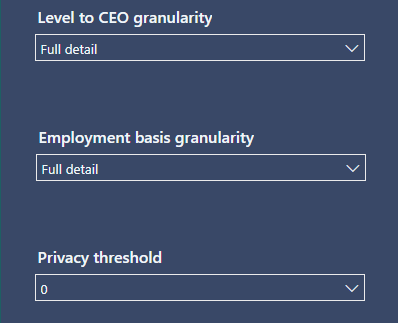
The filters to adjust the level of detail for indicator 1 are called ‘de-identification’ filters. To access the de-identification filters, click on the ‘funnel’ icon and select the ‘De-identification’ button.
There are 3 filters, with different levels of detail:
- Level to CEO granularity
- Employment basis granularity
- Privacy threshold
Figure 9: Screenshot of filter drop down menus
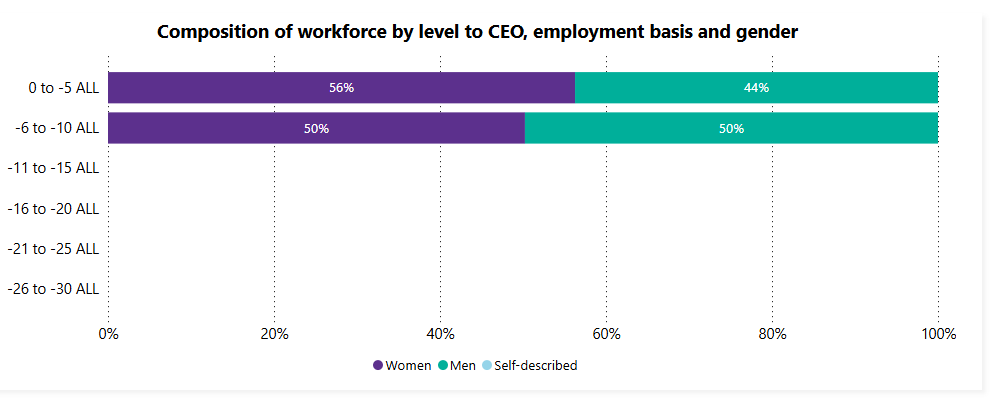
By adjusting the ‘level to CEO granularity’ filters to ‘group by fives’, the measure changes to the following figure.
Figure 10: Screenshot of the data measure with ‘group by fives’ filter applied to ‘Level to CEO granularity’
Notice how each row now represents a set of 5 levels. However, these are still combined with a single employment basis per row. It is less fine than the previous figure, but there are many rows to inspect.
By adjusting the ‘Employment basis granularity’ filter to ‘No detail’, the measure changes to the following figure.
Figure 11: Screenshot of the data measure with ‘No detail’ filter applied to ‘Employment basis granularity’
Notice how each row now represents only a set of 5 levels. It does not include an indicator of employment basis. There are few rows to inspect here.
In this form, the measure may be useful for comparing gender composition only with respect to level.
Similarly, the same measure can be adjusted to the other extreme, showing employment basis only and having no detail for level. The measure would then change to the following figure.
Figure 12: Screenshot of the data measure showing ‘Employment basis’ only
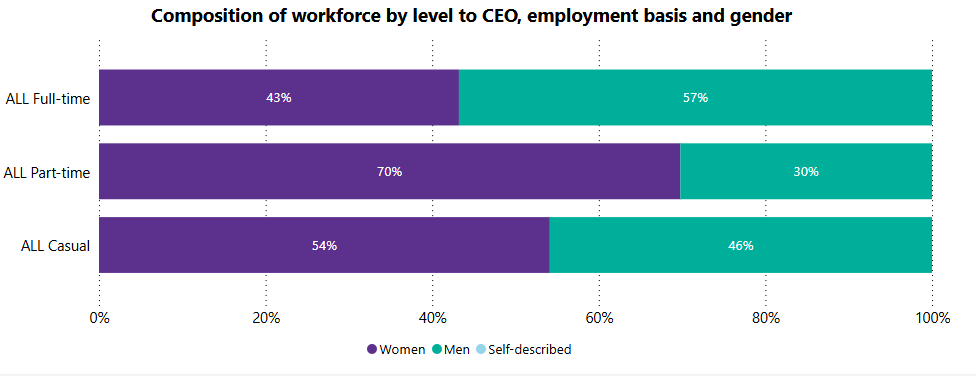
Notice how each row now represents an employment basis but shows no level detail.
Indicator 1 has filters for:
- Level to CEO granularity
- Employment basis granularity
- Privacy threshold (for hiding small result sets)
- Intersectionality (Aboriginality, Age, Cultural identity, Disability, Religion, Sexual orientation).
Indicators 2 through 7 have filters that differ based on the data they are presenting.
Employee experience data cannot be filtered by the reporting platform. If your organisation participates in the People matter survey, you may be able to apply limited filtering the Victorian Public Sector Commission’s reporting dashboard.
To access the People matter survey dashboard for your organisation, please use the Request workforce and people matter survey data - VPSC(opens in a new window) on the VPSC website.
Updated